Ever look at the sqlite3 DB in the Photos.app library bundle ~/Pictures/Photos Library.photoslibrary? So much stuff. I would suggest making a copy of it, and only mess around with the copy.
import sqlite3

# Connect to your database
conn = sqlite3.connect('/path/to/your/Photos copy.sqlite')
cursor = conn.cursor()

# Get the list of tables
cursor.execute("SELECT name FROM sqlite_master WHERE type='table';")
tables = cursor.fetchall()

# Loop through the tables and check for columns containing "SCORE"
for table in tables:
    table_name = table[0]
    cursor.execute(f"PRAGMA table_info({table_name});")
    columns = cursor.fetchall()
    for column in columns:
        column_name = column[1]
        if "SCORE" in column_name:
            print(f"Table '{table_name}' has a column '{column_name}' containing 'SCORE'.")

# Close the connection
conn.close()
The output of the above code is shown below:
Table 'ZCOMPUTEDASSETATTRIBUTES' has a column 'ZBEHAVIORALSCORE' containing 'SCORE'.
Table 'ZCOMPUTEDASSETATTRIBUTES' has a column 'ZFAILURESCORE' containing 'SCORE'.
Table 'ZCOMPUTEDASSETATTRIBUTES' has a column 'ZHARMONIOUSCOLORSCORE' containing 'SCORE'.
Table 'ZCOMPUTEDASSETATTRIBUTES' has a column 'ZIMMERSIVENESSSCORE' containing 'SCORE'.
Table 'ZCOMPUTEDASSETATTRIBUTES' has a column 'ZINTERACTIONSCORE' containing 'SCORE'.
Table 'ZCOMPUTEDASSETATTRIBUTES' has a column 'ZINTERESTINGSUBJECTSCORE' containing 'SCORE'.
Table 'ZCOMPUTEDASSETATTRIBUTES' has a column 'ZINTRUSIVEOBJECTPRESENCESCORE' containing 'SCORE'.
Table 'ZCOMPUTEDASSETATTRIBUTES' has a column 'ZLIVELYCOLORSCORE' containing 'SCORE'.
Table 'ZCOMPUTEDASSETATTRIBUTES' has a column 'ZNOISESCORE' containing 'SCORE'.
Table 'ZCOMPUTEDASSETATTRIBUTES' has a column 'ZPLEASANTCAMERATILTSCORE' containing 'SCORE'.
Table 'ZCOMPUTEDASSETATTRIBUTES' has a column 'ZPLEASANTCOMPOSITIONSCORE' containing 'SCORE'.
Table 'ZCOMPUTEDASSETATTRIBUTES' has a column 'ZPLEASANTLIGHTINGSCORE' containing 'SCORE'.
Table 'ZCOMPUTEDASSETATTRIBUTES' has a column 'ZPLEASANTPATTERNSCORE' containing 'SCORE'.
Table 'ZCOMPUTEDASSETATTRIBUTES' has a column 'ZPLEASANTPERSPECTIVESCORE' containing 'SCORE'.
Table 'ZCOMPUTEDASSETATTRIBUTES' has a column 'ZPLEASANTPOSTPROCESSINGSCORE' containing 'SCORE'.
Table 'ZCOMPUTEDASSETATTRIBUTES' has a column 'ZPLEASANTREFLECTIONSSCORE' containing 'SCORE'.
Table 'ZCOMPUTEDASSETATTRIBUTES' has a column 'ZPLEASANTSYMMETRYSCORE' containing 'SCORE'.
Table 'ZCOMPUTEDASSETATTRIBUTES' has a column 'ZSHARPLYFOCUSEDSUBJECTSCORE' containing 'SCORE'.
Table 'ZCOMPUTEDASSETATTRIBUTES' has a column 'ZTASTEFULLYBLURREDSCORE' containing 'SCORE'.
Table 'ZCOMPUTEDASSETATTRIBUTES' has a column 'ZWELLCHOSENSUBJECTSCORE' containing 'SCORE'.
Table 'ZCOMPUTEDASSETATTRIBUTES' has a column 'ZWELLFRAMEDSUBJECTSCORE' containing 'SCORE'.
Table 'ZCOMPUTEDASSETATTRIBUTES' has a column 'ZWELLTIMEDSHOTSCORE' containing 'SCORE'.
Table 'ZDETECTIONTRAIT' has a column 'ZSCORE' containing 'SCORE'.
Table 'ZMEDIAANALYSISASSETATTRIBUTES' has a column 'ZACTIVITYSCORE' containing 'SCORE'.
Table 'ZMEDIAANALYSISASSETATTRIBUTES' has a column 'ZAUTOPLAYSUGGESTIONSCORE' containing 'SCORE'.
Table 'ZMEDIAANALYSISASSETATTRIBUTES' has a column 'ZBLURRINESSSCORE' containing 'SCORE'.
Table 'ZMEDIAANALYSISASSETATTRIBUTES' has a column 'ZEXPOSURESCORE' containing 'SCORE'.
Table 'ZMEDIAANALYSISASSETATTRIBUTES' has a column 'ZVIDEOSCORE' containing 'SCORE'.
Table 'ZMEDIAANALYSISASSETATTRIBUTES' has a column 'ZWALLPAPERSCORE' containing 'SCORE'.
Table 'ZMEDIAANALYSISASSETATTRIBUTES' has a column 'ZAUDIOSCORE' containing 'SCORE'.
Table 'ZMEDIAANALYSISASSETATTRIBUTES' has a column 'ZVIDEOSTICKERSUGGESTIONSCORE' containing 'SCORE'.
Table 'ZMEDIAANALYSISASSETATTRIBUTES' has a column 'ZSETTLINGEFFECTSCORE' containing 'SCORE'.
Table 'ZMEMORY' has a column 'ZSCORE' containing 'SCORE'.
Table 'ZMOMENT' has a column 'ZAGGREGATIONSCORE' containing 'SCORE'.
Table 'ZQUESTION' has a column 'ZSCORE' containing 'SCORE'.
Table 'ZVISUALSEARCHATTRIBUTES' has a column 'ZSTICKERCONFIDENCESCORE' containing 'SCORE'.
Table 'ZDETECTEDFACE' has a column 'ZBLURSCORE' containing 'SCORE'.
Table 'ZPHOTOSHIGHLIGHT' has a column 'ZPROMOTIONSCORE' containing 'SCORE'.
Table 'ZASSET' has a column 'ZCURATIONSCORE' containing 'SCORE'.
Table 'ZASSET' has a column 'ZHIGHLIGHTVISIBILITYSCORE' containing 'SCORE'.
Table 'ZASSET' has a column 'ZICONICSCORE' containing 'SCORE'.
Table 'ZASSET' has a column 'ZOVERALLAESTHETICSCORE' containing 'SCORE'.
Table 'ZASSET' has a column 'ZPROMOTIONSCORE' containing 'SCORE'.
Table 'ZASSET' has a column 'ZSTICKERCONFIDENCESCORE' containing 'SCORE'.
… so then you can do stuff like:
select
	ZFILENAME,
	ZOVERALLAESTHETICSCORE
from
	ZASSET z
order by
	z.ZOVERALLAESTHETICSCORE DESC
limit 50;
Measuring system-wide activity on a computer usually begins by measuring the aggregate utilization of key hardware components like CPU, storage, and network. These kinds of metrics generally come in two different forms: counters and snapshots. Understanding the difference is important, because they are not always equally useful.
A counter keeps track of the total number of ‘units’ processed by the resource, like octets across a network device or blocks read or written on a storage device. (I am specifically avoiding the word ‘work’, because that’s a whole can of worms.) Counters usually start at zero (boot time) and increment forever until they roll over. Assuming a counter’s value is maintained by the sole arbiter of the hardware resource (i.e. the kernel), you can be confident that all the activity of that resource is represented in the counter’s value.
A snapshot, on the other hand, is basically a way to answer a question like “how much is happening right now” – the important part being “right now”. Computers are very fast, so any kind of instantaneous measurement often describes a very small time quantum – which is a very different scope compared to a counter’s reference point (“since boot”). Any sort of rate is a snapshot.
Let’s proceed to the thrust of this post with an automobile analogy: using CPU utilization to measure overall CPU activity is like trying to infer how far a car has traveled by looking at the speedometer instead of the odometer. To demonstrate, open Activity Monitor (or top, htop, etc), wait a few seconds to get a ‘baseline’, then run the following small shell script:
while true ; do /bin/echo zoop > /dev/null ; done
While that script is running, you should see an uptick in activity, but you may never see echo in the process list. That’s because the amount of time required by echo to zoop to /dev/null is small compared to the amount of time it takes to start any new process (on Darwin-based systems like macOS, iOS, etc). For that reason, any instantaneous snapshot of active processes is statistically unlikely to include very short-lived processes – even if there are thousands of such processes being spawned every second. You can see where some of that ‘startup time’ is going in the form of work done by long-lived processes like kernel_task or dznd.
As it happens, macOS does provide a way to poll usage counters for (recently) deceased processes. The CLI tool powermetrics can fetch it for you. Let’s ask for the tasks category of data and pull just the cputime_ms_per_s value from the all_tasks dictionary. Something in this data isn’t json-compatible so no svelte jq one-liners – let’s use Python.
#!python -u

import subprocess
import plistlib
import sys

"""
Print selected power metrics from /usr/bin/powermetrics at intervals, suitable for graphing.
"""

interval = sys.argv[1] if len(sys.argv) > 1 else 1000
cmd = f"sudo powermetrics -i {interval} -s tasks --format plist"

# Execute the long-running command, which produces one plist to stdout every
# interval, spread across multiple lines.
# For each line of output from `powermetrics`:
#   - accumulate lines into a bytearray
#   When "</plist>" is seen:
#    - parse the accumulated bytearray into a plist
#    - print the metric of interest
#    - clear the bytearray
pl = bytearray()
# using shell mode here because we need sudo for powermetrics
for line in subprocess.Popen(cmd, shell=True, stdout=subprocess.PIPE).stdout:
    pl.extend(line)
    # look for the plist close tag
    if "</plist>" in str(line):
        # powermetrics adds a null byte at the start of each plist after the
        # first, which breaks the plist parser.  Remove it.
        if pl[0] == 0:
            pl = pl[1:]
        d = plistlib.loads(pl[0:])
        print(d.get('all_tasks').get('cputime_ms_per_s'))
        pl = bytearray()
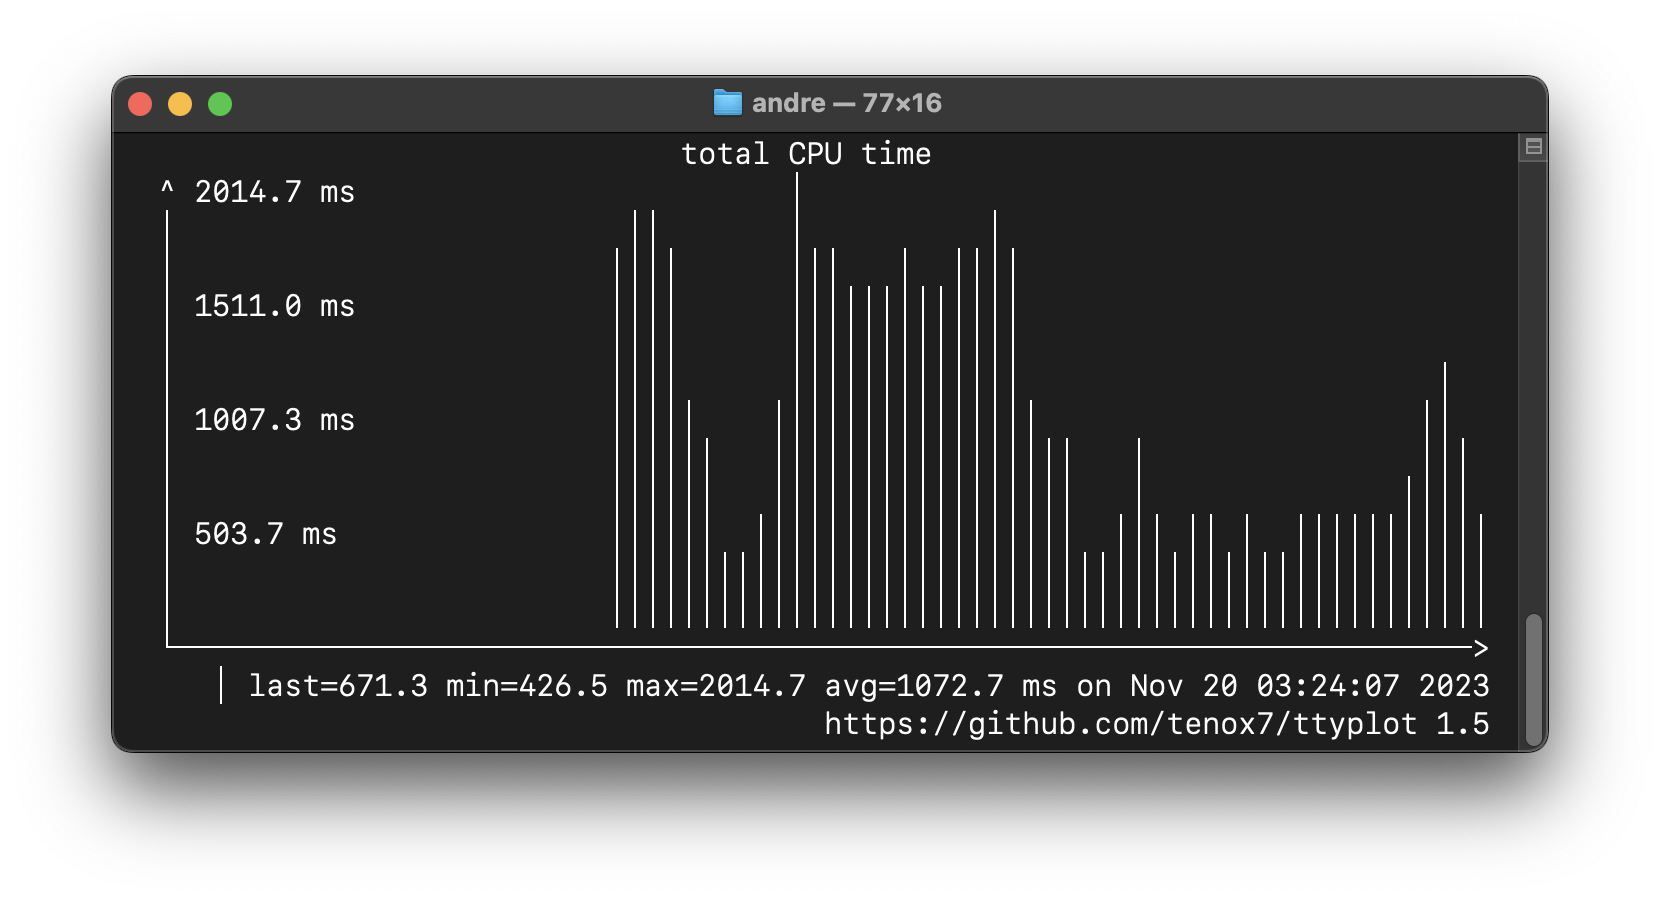
Make sure you have sudo rigged up to work without a password, or if you don’t, just run sudo whoami no more than 5 minutes before running the above in the same terminal. Instead of just reading lines of numbers, let’s pipe to ttyplot. Here’s a picture of a ttyplot showing what happens when I run the echo loop from earlier:
The big chunk there is when I was running the loop, but the first little chunk was ‘something else’. If this feels unsatisfying, you’re thinking correctly :) The difference between the low point and the high point in this graph feels around the same as the difference you can see in Activity Monitor or htop when running the echo loop. If your intuition suggests there’s more going on that we’re not yet seeing, that’s also correct!
Let’s stop beating around the bush: by far the best metric for measuring overall system activity level is power consumed. As the name suggests, powermetrics has that for us also. This time let’s ask for the cpu_power category, and fetch the value at processor.combined_power.
In the above graph, I ran the shell loop for two bursts that are clearly visible and substantially above the noise floor.
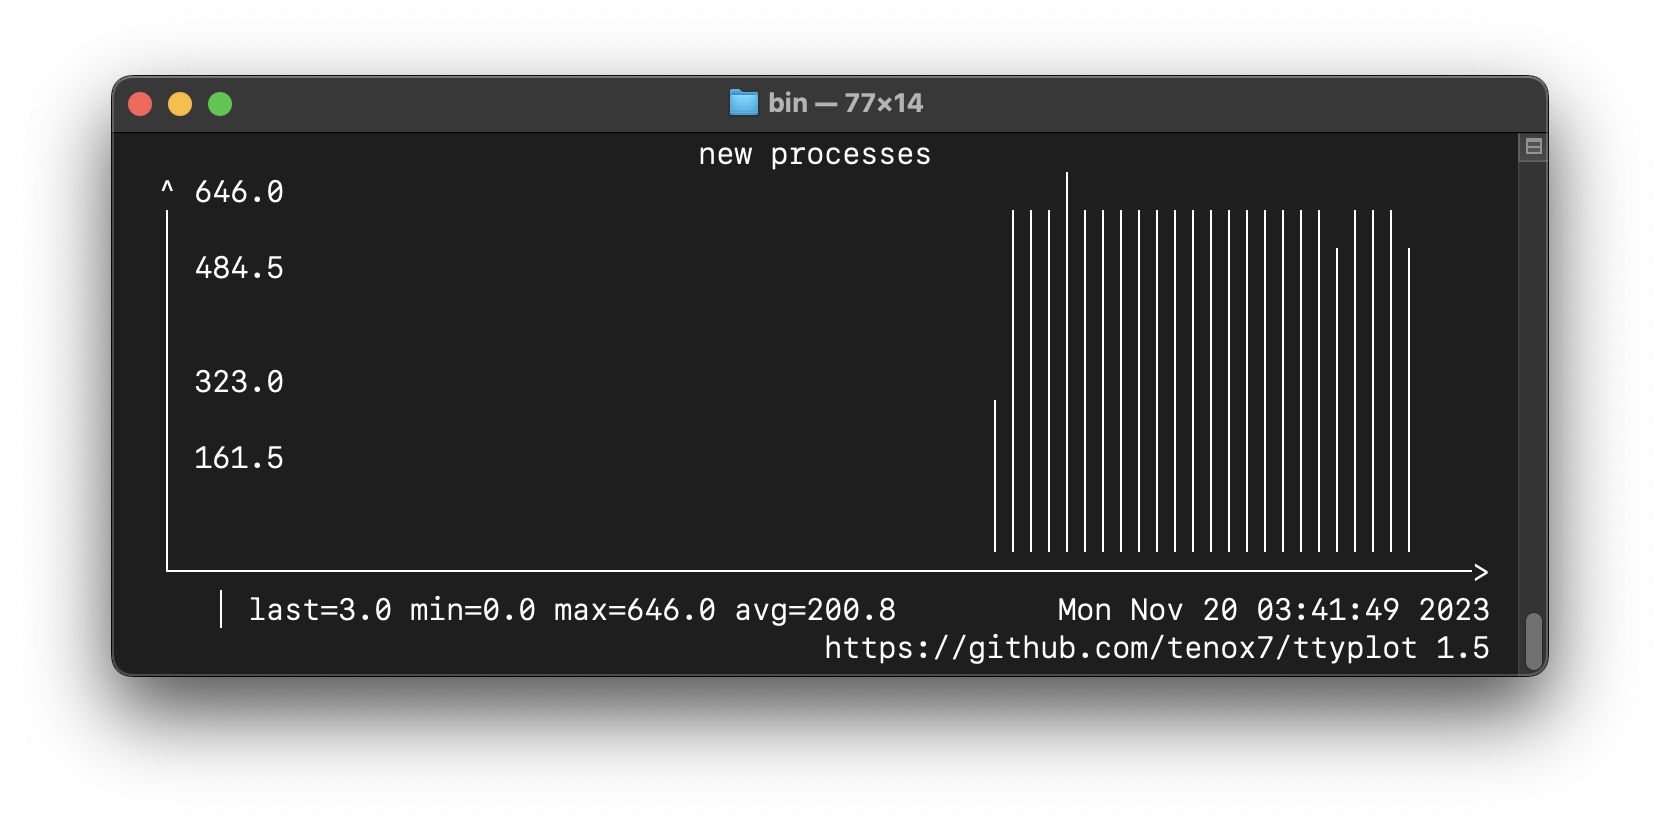
As a bonus, here’s a little program that prints out the number of new processes created every interval (without burning a PID in the process… heyo), which I will call pidpersec.c, as a nod to the script it’s replacing: pidpersec.d. Running the shell loop with that program’s output piped to ttyplot looks like this:
Most of the time, I just proceed straight to asking my computer to do stuff for me. Sometimes, especially when I don’t yet know what stuff I want, I will instead start by asking my computer not to do stuff, over and over until it’s actually not doing anything that rises above the expected noise floor. Reducing noise allows my human senses to be more effective.
Central to this whole process is having a noise floor expectation in the first place. That’s hard to define precisely, and varies based on many factors, but generally I use one of these criteria:
some process spawning repeatedly for no discernible reason in tight time intervals
some process using more than 10% CPU when you think the system should be idle
Over the years, I’ve noticed impressive variety in the range of disquieted things I encounter, and the specific techniques I use to soothe them. This seems like an ideal pretext for a collection of blog entries, so here’s the first one in that category.
Trivia question: what kind of protection should you wear when calling diff from a Shortcuts.app “Run Shell Script” action?
You should affix the Splashguard of Departure, ideally with some +charisma to offset the posix misalignment. This is because “Run Shell Script” actions are executed with an implicit set -e. I’ll elaborate.
set -e means the script (and by extension, the whole shortcut) is halted whenever any of the commands executed in the script exit non-zero. It is customary for tools of the posix persuasion to set their exit status to zero upon success and non-zero upon failure. The trick with common but not mandatory behaviors is that the exceptions tend to sting. diff and a few of its siblings are exceptional in this regard, although you wouldn’t learn about that directly from the diff man page. Instead, you have to accept the challenge found at the bottom of the diff man page:
The full documentation for diff is maintained as a Texinfo manual.  If the info and diff programs are properly installed at your site, the command
              info diff
should give you access to the complete manual.
Respect to elders notwithstanding, Texinfo is a total train wreck every time I try to use it, so please accept this shortcut:
andre@boom ~ % info diff 2> /dev/null | grep -A 1 'exit status of'
   An exit status of 0 means no differences were found, 1 means some
differences were found, and 2 means trouble.
--
   An exit status of 0 means no differences were found, 1 means some
differences were found, and 2 means trouble.
--
   An exit status of 0 means `diff3' was successful, 1 means some
conflicts were found, and 2 means trouble.
--
   An exit status of 0 means no differences were found, 1 means some
differences were found, and 2 means trouble.
For example, in this shortcut, the first action completes because diff exits zero, but the second action causes the shortcut to fail with Exit code: 1. If it’s a big script, it might even take you a while to pinpoint the problem.
Normally I would run newproc.d to monitor command executions in real time, but that requires disabling SIP, which I usually have enabled these days due to this unfortunate constraint. I don’t know if newproc.d would have been the last place I had to look, but I suspect it would have.
Instead I turned to supraudit which does show all the commands executed from the script – EXCEPT the one that fails the whole shortcut, which is probably a clue if you’re looking closely enough. Console logs are mostly useless in this case without ‘private data‘, which is inconvenient to get – for your protection, of course. I eventually found the culprit by testing progressively smaller scripts until diff alone was causing failures.
Right then, the remedy: Splashguard of Departure is easily crafted from two ingots and one eternal truth. Its magical effects include the formation of a specialized tribunal that serves to contain the representations of diff’s quality of departure that are not tolerated in this locale. In the following example, eternal truth (i.e. /bin/true) is replaced with a small placard which works just as well.
Here’s a method to find where any given NSUserDefault setting is persisted. This might help if you’re trying to write a script to get or set that setting. As a bonus, this post details a reusable strategy for withstanding the cacophonous onslaught of os_log long enough to find what you came for, or convince yourself it’s not there.
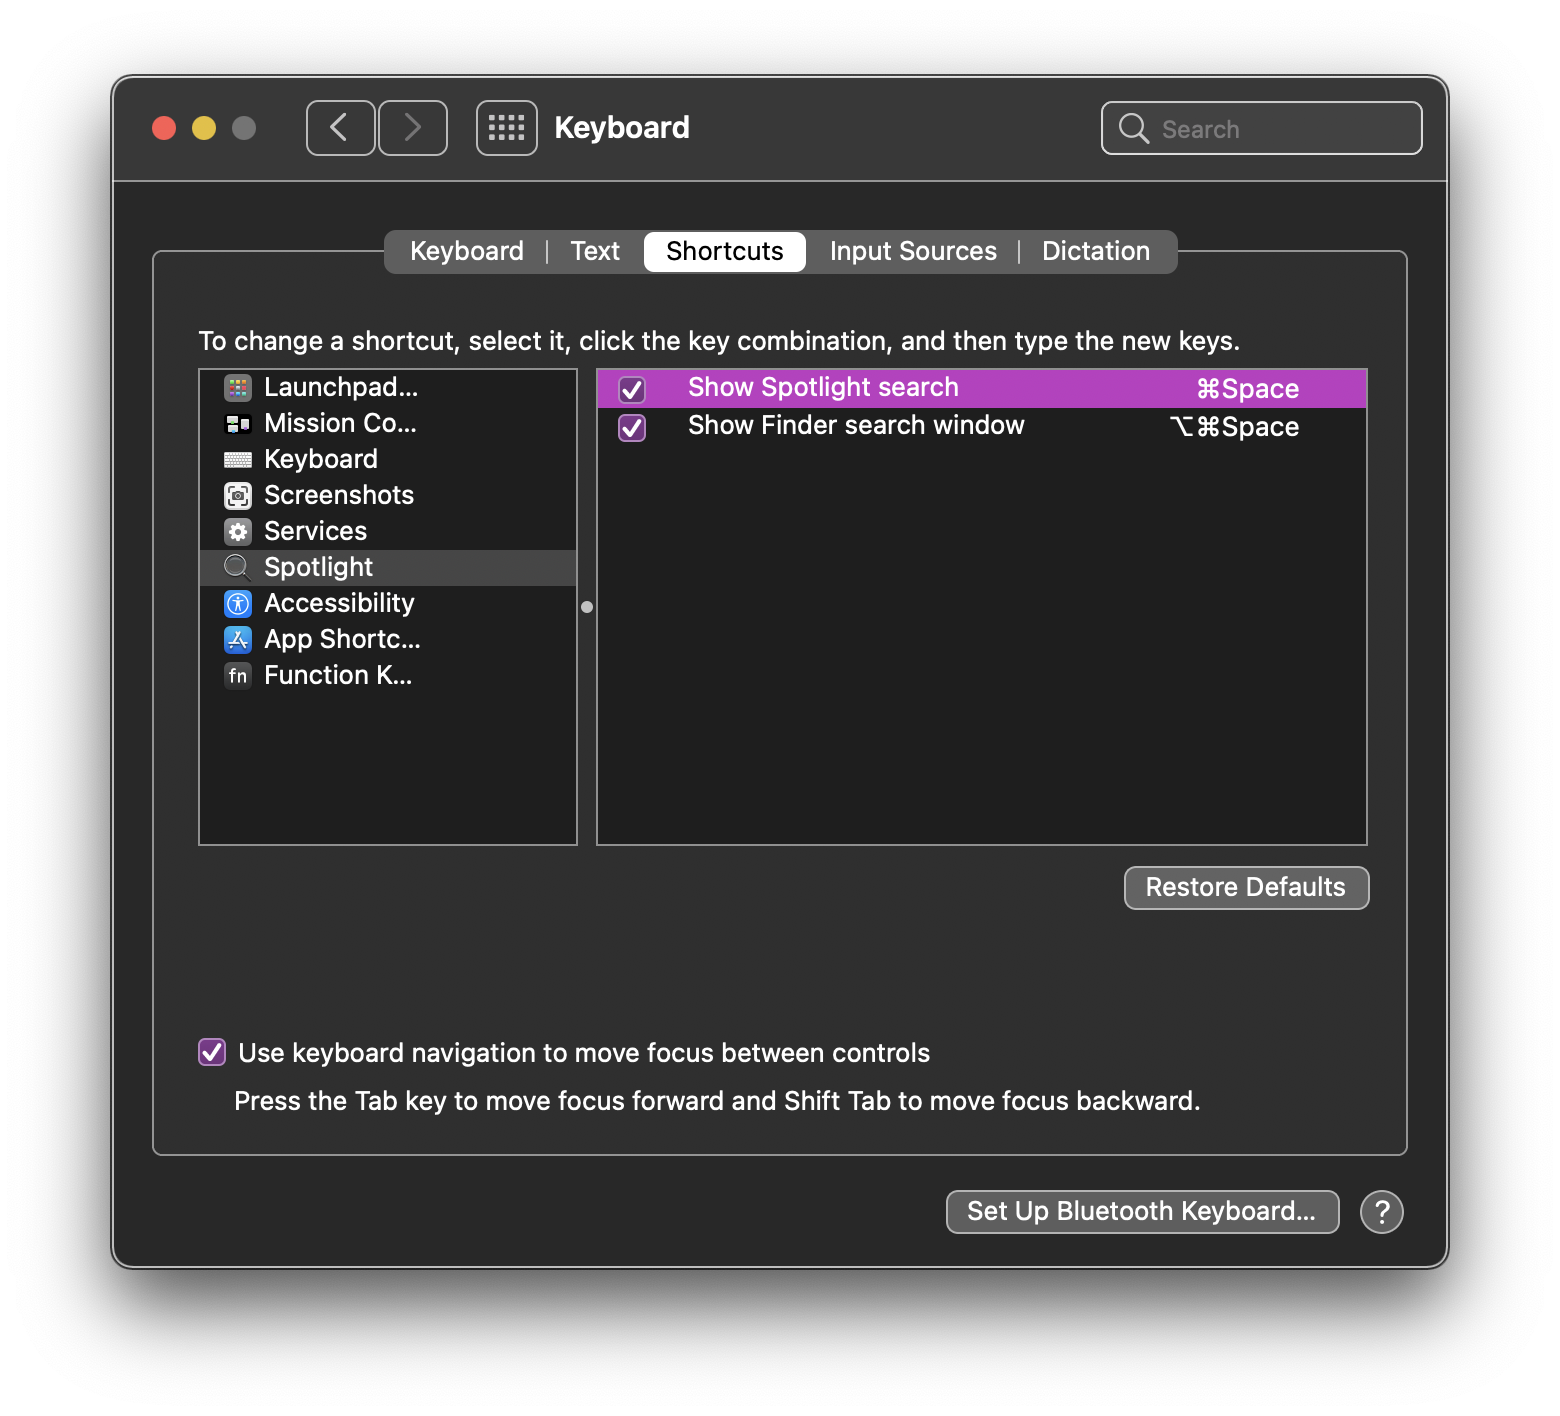
For this example, let’s say you’re trying to find where macOS stores the hotkey for invoking Spotlight. The UI for this is System Preferences –> Keyboard –> Shortcuts –> Spotlight, and the setting is called ‘Show Spotlight search’.
The Shortcuts tab of the Keyboard pane of System Preferences with Spotlight selected
We know that macOS logs quite a bit – so much, in fact, that the hard part about using logs is achiving a favorable signal to noise ratio. It’s usually much easier to select signal than it is to filter noise – especially if you already know something about what you’re looking for. For this case study we can get an initial lead, but even if we couldn’t, our strategy will still work, maybe with an extra iteration or two.
The log man page tells us we can match log events in lots of ways, including by process – but which process should we look upon?
andre@boop ~ % apropos prefs
CPAN::Distroprefs(3)     - -- read and match distroprefs
cfprefsd(8)              - defaults server
If I didn’t already know that cfprefsd is our target, I would read the cfprefsd man page (because all apropos results are man pages). We could start by listening to all of cfprefsd by running:
… but that output is not so easy to read. Let’s use log‘s ndjson output style so we can view it with jq, but first let’s make sure the json output is clean enough (foreshadowing!)
andre@boop ~ % log stream --predicate 'process == "cfprefsd"' --style ndjson --debug
Filtering the log data using "process == "cfprefsd""
{"traceID":36107480853643780,"eventMessage":"Process 68 (UserEventAgent)
...
Nope, jq won’t like that, so let’s filter the log output with egrep --line-buffered '^{' to only pass lines starting with { to jq. Don’t forget --line-buffered, otherwise grep ‘helps’ by saving a tiny fraction of computer by showing output less often, which grep believes is appropriate because it doesn’t think there’s a human watching (because its stdout isn’t connected to a terminal, it is connected to jq).
Before we continue, as our log command is becomming lengthy, let’s clean up a little by setting some common options in ~/.logrc (described in the log man page). Here’s a command to populate ~/.logrc with some settings useful for the task at hand:
Definitely more legible, but… the above represents a single log event. We can do better. eventMessage has the interesting info, so let’s look only at that by using a jq filter: '. | .eventMessage'
andre@boop ~ % log stream --predicate prefs \
| egrep --line-buffered '^{' | jq '. | .eventMessage'
"Process 1347 (ContextStoreAgent) sent a request related to { ContextStoreAgent, user: andre, kCFPreferencesAnyHost, /Users/andre/Library/Preferences/ContextStoreAgent.plist, managed: 0 } (0x7fe2c19057d0)"
"Process 1347 (ContextStoreAgent) sent a request related to { ContextStoreAgent, user: andre, kCFPreferencesAnyHost, /Users/andre/Library/Preferences/ContextStoreAgent.plist, managed: 0 } (0x7fe2c19057d0)"
"Process 97346 (PerfPowerServices) sent a request related to { com.apple.powerlogd, user: kCFPreferencesAnyUser, kCFPreferencesCurrentHost, /Library/Preferences/com.apple.powerlogd.plist, managed: 0 } (0x7fb3ee304a30)"
In this case that’s probably close enough, and you’ll probably see stuff about keys being written. Let’s pretend it’s still too noisy. What if we had a way to see only the different kinds of messages without the dynamic parts of each. We do! Just ask for formatString instead of eventMessage, then sort | uniq.
There is a complication, though. If you append sort | uniq to the previous pipeline and run it, you will see no output – this is because both sort and unique can’t run in stream mode; they have to receive all the input before they can do their job. If you simply control-c to terminate log, this seems to cause the in-flight log data to become malformed some time before it reaches jq. Instead of figuring that out, I opted to forgo log stream in favor of log show, because log show doesn’t run forever, so I won’t have to control-c it and have broken pipes.
There’s still one more problem (this is the last one, honest). Let’s have a look at the logd man page:
     All processes that use os_log(3) share pages of memory with logd and
     append entries to them.  logd reads pages and combines and compresses
     this data.  Depending on configured policies, it keeps them in a local
     ring buffer or writes them out to persistent storage.

           { logd }
              | `---> [ buffer ] ----.
              |                      ,`---> { log show }
              `---> [ data store ] -'
You may have noticed "messageType": "Debug", in the previous output, indicating that the messages of interest are logged at the debug level. When you pass the --debug option to log stream, log temporarily activates debug-level messages so you can see them as they happen, and then disables debug mode when you control-c. In other words, switching to log show won’t work until we enable debug-level messages some other way. There are at least two ways to do this according to the log man page:
# change the global log level to debug
sudo log config --mode "level: debug"

# ... or set a specific subsystem to debug
sudo log config --subsystem 'com.apple.defaults' --mode level:debug --mode persist:debug
I don’t like the first method because it doesn’t stick – the next time a log stream command exits, log helpfully disables debug-level messages, even if they were enabled before running log stream.
Note that when targeting a subsystem, we also need to enable persisting of the debug-level messages, otherwise those messages will briefly pass through the in-memory ring buffer before being forgotten.
We can now finally achieve a good summary of log activity by simply counting the unique instances of formatString values.
andre@boop % log show --last 10m --predicate prefs \
| egrep --line-buffered '^{' | jq '. | .formatString' > fstrings

andre@boop % cat fstrings | sort | uniq -c | sort -n
   1 null
  32 "Data for { %@, %@ } was purged due to memory pressure"
  32 "no cache for { %{public}s, %{public}s, %{public}s, %{public}s, managed: %d }, loading from %{public}s"
  38 "wrote file %{public}s"
  42 "Notifying observers of { %{public}s, %{public}s, %{public}s, %{public}s, managed: %d }"
  82 "Process %{public}d (%{public}s) wrote the key(s) %{public}s in { %{public}s, %{public}s, %{public}s, %{public}s, managed: %d }"
  90 "Process %{public}d (%{public}s) read data for { %{public}s, %{public}s, %{public}s, %{public}s, managed: %d }, backed by %{public}s"
 416 "Process %{public}d (%{public}s) sent a request related to { %{public}s, user: %{public}s, %{public}s, %{public}s, managed: %d } (%p)"
 482 "Couldn't %{public}s %{private}s due to %{public}s"
Ok, wrote file ... and process ... wrote the key(s) ... look promising for this sample case. Let’s update our .logrc file to add a stanza for show. Also change the prefs predicate macro to specify category = "cfprefsd" instead of process (not strictly required, but good to use categories when possible). Lastly, add another predicate macro called keys to conjure a refined version of the prefs search that will only return events that represent writes to NSUserDefaults.
If you came to learn how to claw law blogs from os_log’s sprawling maw, get on outta here Bob Loblaw – the rest is about hotkeys.
There are at least two different representations of hotkeys you might encounter in NSUserDefaults. NSUserKeyEquivalents (as in defaults find NSUserKeyEquivalents) is pretty self-explanatory, but there’s also AppleSymbolicHotKeys which is somewhat more opaque.
Looking at the whole file, it seems like maybe the different functions that can be assigned hotkeys are represented here by a numeric ID, and 64 is the one for “show spotlight search”. The parameter values are key codes.
I found a neat app called Key Codes that can be used to understand how the key code values work. For example, if I:
disable the spotlight command-space hotkey so that Key Codes can capture that hotkey
click the little ‘i’ button adjacent to ‘Modifiers’
compare that to the data we found from NSUserDefaults
… we see that the codes for command-space are 32, 49, 1048576 – note especially that the stored value does not include the device-specific aspect of the modifier (0x8). This matches what is shown in the diff output above from hotkey1.plist
Screenshot of the app Key Codes displaying key code information about the hotkey ‘?-space’
I experiment with lots of different software – there are currently 308 items in /Applications and 508 git repos in ~/work (only a handful of which are directly job related). If you’re thinking something like “that’s gross, I bet your computer is an ecohazard” – nope! That’s the point: exercise software muscles to keep them strong, but also to satisfy some wayfaring curiosity or other that fuels the exercise in the first place. Despite finely tuned situational awareness and well-rehearsed mole-whacking techniques, sometimes one slips through the cracks.
Honestly I forget how long it’s been since quicklook previews of certain file types have worked correctly on this machine, but I do have a vague memory that it’s probably my fault. As of today, I’ve Had Enough Of This (™). That unspecified guilty feeling was enough to quickly lead me to the general vicinity of the root cause:
? ls -l ~/Library/QuickLook/
total 0
drwxr-xr-x 3 andre staff 96 Nov 8 2018 QLCARFiles.qlgenerator
drwxr-xr-x 3 andre staff 96 Dec 15 11:36 QLColorCode.qlgenerator
drwxr-xr-x 3 andre staff 96 Oct 21 2019 QLMarkdown.qlgenerator
Oh I know, maybe if I can get some quality time with quicklook in a setting where we can really communicate with each other using our natural file descriptors, perhaps I’ll have a better chance of understanding what’s wrong… just incase, maybe, perhaps, the full range of potentially useful messages cannot be expressed through the rigid and unfeeling glory hole known as QLPreviewController.
Real friends don’t keep their STDERR all bottled up inside, they SHARE IT, because silent failure results in silent not-getting-helped whilst simultaneously letting all your friends down because you can no longer do your job.
–Citizens for Concerned Citizens
Ok, come here. You trust me, right? Ok.
? qlmanage -p /Users/andre/work/Playtime-Quicker/Playtime\ Quicker/PQDevice.swift
Testing Quick Look preview with files:
/Users/andre/work/Playtime-Quicker/Playtime Quicker/PQDevice.swift
dyld: Library not loaded: /opt/brew/opt/lua/lib/liblua.5.3.dylib
Referenced from: /opt/brew/bin/highlight
Reason: image not found
dyld: Library not loaded: /opt/brew/opt/lua/lib/liblua.5.3.dylib
Referenced from: /opt/brew/bin/highlight
Reason: image not found
2021-02-12 19:27:00.609 qlmanage[6260:4238976] QLColorCode: colorize.sh failed with exit code 101. Command was ('/Users/andre/Library/QuickLook/QLColorCode.qlgenerator/Contents/Resources/colorize.sh' '/Users/andre/Library/QuickLook/QLColorCode.qlgenerator/Contents/Resources' '/Users/andre/work/Playtime-Quicker/Playtime Quicker/PQDevice.swift' 0).
...
That’s all?! Oh, COME ON. QuickLook! You’ve been allowing yourself to face certain death at any time, night or day, for months on end, when all you had to do was literally anything at all to get my attention, then I could have magically fixed all of your problem in like 5 seconds? You didn’t want to bother me?!? I’m not sure you understand how easily this problem can happen, how often it actually happens, or that it’s not your fault.
brew upgrade highlight
I know, QuickLook. I know that deep down, you DO want to help me help you, but you can’t because your current employer does not allow it. No easy answers there, you just gotta ride it out. If it comes to pass that the train you’re hitched to eventually derails because what was once a healthy ecosystem with a supportive and empowered community has become a haphazard array of isolated and inflexible components that serve their vendor more than their user… well, sit tight, I’ll come back for ya ;)
I first wrote this as a comment to a Veritasium video that analyzes the perils of a recommendation-based approach to content distribution. In attempting to link to that comment on Twitter, I found myself unable to do so because Twitter or Youtube or both don’t seem to give a shit about preserving user intent. Well, fuck you both, this is my website, and that comment is hosted below.
In the 1990s, before Internet use exploded, there were no large-scale Internet content distributors that value ‘engagement’ above all else, because there weren’t enough users to sustain an advertising-based business model (a state that I hold in much higher regard now than I did back then). There was still plenty of worthwhile stuff to find, but you had to know how to find it. It’s not hard to do, but it does require some effort: typing into a search field, bookmarking things, making lists, setting reminders… and the hardest one of all (then and now): remembering to search in the first place. All of these are critical skills that need to be USED to get the most out of the Internet. Just like muscles, without use you get atrophy.
As the Internet gained users, it became increasingly crowded with corporations, which largely fueled that expansion. In the same way that YouTube and pretty much every commercial web presence wants to increase engagement (because eyeballs are currency if you’re counting advertising impressions), corporations in general tend to value growth and shareholder value over everything else. They figured out a long time ago that reducing friction usually yields more customers. That’s not always a bad thing; for example a hand tool that’s easier to use because it has a molded hand grip is just more effective than one without a hand grip. Ease-of-use is an important part of the overall cost / benefit analysis, for both consumers and producers.
The trick is that the cost / benefit continuum extends in both directions. It is optimistic (but naive) to think about that continuum in one direction: “people are probably willing to sustain a higher cost to receive a greater benefit” while not also thinking of the other direction where people are willing to pay a lower cost to receive less benefit. Sure, lots of people have the ability to exclusively watch movies or shows that they select themselves (e.g. DVDs), but a huge number of people would rather watch something they didn’t select if it means they don’t have to work for it. It is almost certain that they won’t be watching precisely what they want to watch all the time, but hey – just think of all that effort saved! “I make choices constantly at work (school, whatever), and now at the end of a long day, I just want to relax and be spoon-fed!”.
Probably the most familiar example of how that trade-off plays out is called ‘television’, and it sucks (IMO) for the very reason that allowed media corporations to grow their empires: they traveled too far down the stupid side of the cost / benefit continuum and destroyed their own ecosystem in the process, while also ‘earning’ absurd amounts of money. There’s a very blurry line between making products and services more accessible in ways that empower people (“molded hand grip”) versus accidentally or on purpose participating in a race to the bottom that yields local, short term gains (“more viewers for ME!”) at the cost of negative global or long-term effects (“I just reinforced mindless consumer behaviors!”). Historical note: TV wasn’t always like that. In the early days when there were only a handful of networks, there was some consideration for the greater good that factored into, say, content programming decisions. That all evaporated with the rise of consumerism and much greater competition in the form of an explosion of TV / video outlets.
One of my favorite things about the Internet is that I get to decide how I use it, where I go, what I produce, and what I consume. To me, it is the polar opposite of TV or any other feed-based outlet. These themes of self-direction and choice were widely shared among early Internet users, and it’s not a coincidence that those same people are also willing to take the more difficult and less convenient path if it unlocks the reward they want – because they had to on the early Internet (auto-play wouldn’t arrive for decades). Yet these days I see so many people – well-meaning, honest, good people – behaving as though they don’t have any choice, and even aligning their own goals with the goals of the very corporations that put them in an unfavorable position. I see this as a direct projection of the world-view that has shaped at least the US economy and culture for the last ~50 years or so, so… ya know… “f*ck you very much, corporate America!”. (side note: yes, I’m absolutely a Youtube Red subscriber).
In closing, a few final thoughts:
Support the creators you care about with currency that is actual money, not ‘engagement’ or any other non-money currency.
If you are a creator, think about how you can directly earn currency-money yourself, if you aren’t already. It’s not supposed to be easy. If it seems easy, you are probably getting jacked.
The biggest scam on the whole Internet is how people were led to believe that something is free if they don’t pay for it in currency-money. Nothing is free when businesses are involved. They’re also very good at hiding the value of whatever kind of non-money currency is being extracted from users, which is terrible because users then have no way to even make a value judgement by asking themselves “is this cost-benefit trade-off worthwhile for me?”, so now the whole idea that you CAN and SHOULD make that choice is starting to disappear.
For a thorough and lucid exploration of these and related concepts, I can’t recommend the documentary “The Century of the Self” highly enough. I mean this so sincerely that I’m not even going to link to it :)
A friend got a 4th gen AppleTV in late 2015 – a friend that enjoys retro video games, but that doesn’t own any consoles. I tried Provenance on my iPad and was pretty satisfied, and figured it would be pretty nifty on the AppleTV. This friend is not a developer, and at the time didn’t own a computer new enough to interface with a modern iOS device. Even if she did, she objected to paying $100 / year for the permission to run a self-built app (an objection I share), so I figured I would handle the building and installing part during one of my occasional visits to her town (~6 hours away by car).
You’re probably already thinking about how this is likely to blow up, and you’re right: roughly 1 year after I deployed the app to the AppleTV, the provisioning profile expired, and then nobody could play pokemon anymore. I felt truly terrible about this. DRM sucks.
Then just a few days ago, the black macbook was replaced with one of the fancy new ones – new enough to speak directly to an AppleTV, new enough to run the current version of Xcode. With the help of a reverse SSH tunnel, I screen shared to her machine to build and install the current version of Provenance, only to find out that the current version uses a different bundle ID. I had no luck convincing Xcode to replace the old Provenance app bundle with the newly built one, using the existing data container.
To my pleasant surprise, Xcode’s Download / Replace Container feature actually saved the day, and I was able to export the ~2 GB container from the old broken-for-years Provenance version, and hand that container to the new Provenance version. This is sort of a bare minimum level of data portability, but it’s more than I expected, so “props”. My friend is pretty excited about picking up where she left off with the pokemans!
I’ve been annoyed by sandbox log verbosity since always, but recently I was pushed over the edge when playing with a tool (htop) that calls task_for_pid a lot. It’s open source, so not code signed or entitled. There are various ways to allow the calls to succeed (e.g. run as root, or add -p to taskgated‘s args and run htop setgid procmod), however this does nothing to alleviate the log spam, because ALLOWED access is still logged – sometimes by both kernel and sandboxd. If you’re making a lot of ‘allowed’ calls, this drives syslogd CPU usage up into the noticeable range. In fact on an otherwise idle system running htop (with -d 5), this effect results in syslogd being the busiest process on the system! Not ok. No love for the boy who cried “no wolf”.
This cuts syslogd CPU usage by about 50% in my testing. Of course I would prefer that these messages were never sent, but it’s an improvement. Note that trunk htop has mitigated this problem by caching (and not retrying) denied attempts, but there’s nothing htop can do about the spam from *allowed* attempts.
I should mention that I’m not allergic to sandbox or policy enforcement in general. This is more of a ‘living in harmony’ kind of thing, and although there are serious ownership-related existential questions breaking through the surface with increasing frequency, this post isn’t about that.
Except for the next sentence. As a thought experiment, see if you can come up with any justification for logging these ‘allow’ messages that benefits the user, and that outweighs both the potential performance impact (read: battery, if you are rolling your eyes right now) and the signal to noise ratio impact.
I know that I’m one thousand years old for looking at log files in the first place (especially when the house *isn’t* on fire), and I’m ok with that. I might even assert that a person could build a career by curiously reading everything the system says.
Recently I did some spelunking into the Adaptive Firewall facility of OS X Server to devise a procedure for troubleshooting a reported failure of AF to block failed SSH logins. Consider this a supplement to this post at krypted. (although do note that the hb_summary tool mentioned there seems to be defunct now).
1) Verify that AdaptiveFirewall (AF) is actually enabled. The “Adaptive” part is what reacts to events such as login failures; I mention this because adding a block rule manually using afctl is roughly equivalent to adding a block rule in pf, and even if this block rule takes effect (because pf is enabled), that does not imply that AdaptiveFirewall is enabled.
2) AF doesn’t detect the events itself; it relies on Event Monitor (emond) for this. Verify that emond is seeing the activity in question.
Verify that AF is creating the correct rules in pf based on what it learns from emond.
First, create the following shell alias to allow easy invocation of afctl:
alias afctl='/Applications/Server.app/Contents/ServerRoot/usr/libexec/afctl'
Verify that AF is enabled
Check to see if AF’s launchd job is running. You should see the com.apple.afctl job listed.
bash-3.2# launchctl list | grep afctl
- 0 com.apple.afctl
If it’s not listed, re-initialize AF. This doesn’t destroy any state. Make sure it exits zero (no error).
bash-3.2# afctl -c ; echo $?
0
Re-enable any previously disabled rules, check exit status.
bash-3.2# afctl -e ; echo $?
0
Force AF into active state, check exit status. Don’t be scared by the pfctl boilerplate about the -f option.
bash-3.2# afctl -f ; echo $?
pfctl: Use of -f option, could result in flushing of rules
present in the main ruleset added by the system at startup.
See /etc/pf.conf for further details.
No ALTQ support in kernel
ALTQ related functions disabled
0
Verify that emond is seeing the auth failure events
Configure emond to do some additional logging. Edit /etc/emond/emond.plist to increase the debugLevel to 4 and set logEvent to true, as shown below:
After making the above change, run: sudo killall emond. There is now an additional log in /Library/Logs/EventMonitor (EventMonitor.event.log), and both that and the error.log now contain more verbose information. Watch these files with tail -f to see ongoing activity. Note that for arcane reasons, a single failed SSH attempt actually results in multiple detected auth failures.
You can also look at /etc/emond.d/state, which is only written upon reception of SIGTERM. The state file lists all the hosts that have attempted to connect to a protected service, along with the count of failed auths. Successful logins are indicated by a bad auth count of zero.
Verify correct rules in pf
pf rules associated with AF are all rooted under a pf anchor (anchor is pf’s word for ‘group’) called com.apple/400.AdaptiveFirewall. Show the active pf rules under this anchor:
bash-3.2# pfctl -s Anchors -a com.apple/400.AdaptiveFirewall -s rules -v
No ALTQ support in kernel
ALTQ related functions disabled
block drop in quick from <blockedHosts> to any
 [ Evaluations: 31705 Packets: 0 Bytes: 0 States: 0 ]
 [ Inserted: uid 0 pid 22564 ]
(note that the ‘evaluations’ counter should be non-zero; if it’s zero that likely means pf isn’t enabled; afctl -f is supposed to do that)
bash-3.2# pfctl -s info
No ALTQ support in kernel
ALTQ related functions disabled
Status: Enabled for 0 days 00:01:31           Debug: Urgent

State Table                          Total             Rate
  current entries                        0
  searches                         2034928        22361.8/s
  inserts                                0            0.0/s
  removals                               0            0.0/s
Counters
  match                             999161        10979.8/s
  bad-offset                             0            0.0/s
  fragment                               0            0.0/s
  short                                  0            0.0/s
  normalize                              0            0.0/s
  memory                                 0            0.0/s
  bad-timestamp                          0            0.0/s
  congestion                             0            0.0/s
  ip-option                            418            4.6/s
  proto-cksum                            0            0.0/s
  state-mismatch                         0            0.0/s
  state-insert                           0            0.0/s
  state-limit                            0            0.0/s
  src-limit                              0            0.0/s
  synproxy                               0            0.0/s
  dummynet                               0            0.0/s
If afctl -f doesn’t enable pf, that’s a bug. If this is the case, you could try manually enabling pf. If it’s already enabled, it says so:
bash-3.2# pfctl -e
No ALTQ support in kernel
ALTQ related functions disabled
pfctl: pf already enabled
pf uses ‘tables’ to efficiently store data associated with rules that only differ by a single element (such as IP address). Show the list of pf tables under the AF anchor:
Show the contents of the blockedHosts table in the AF anchor. In the below output, I manually added 2.3.4.5 using afctl, and x.x.x.x is a redacted address that was automatically added by AF due to failed SSH login attempts.
… I think that’s pretty much everything, except for some errata:
* Starting from a clean slate, you can get the failed auth counter for a given sending host up to 25 very quickly. At that point, the block rule is created and lasts for 15 minutes by default. No failed auths happen from that host in this 15 minute window, because the sending host is blocked and can’t reach sshd. After the 15 minute interval, the block rule is removed. An additional failed auth earns the sending host another 15 minute block rule. The bad auth counter is only reset by a successful login from that host.
* A block rule is only created once there have been 25 failed auths from the same IP address. This value is configurable with afctl. There is no time window associated with this policy. Therefore, a botnet with 100 hosts would be able to attempt 100 * 25 SSH auths against your server. As there is no reliable way to know that you’re being hit by a botnet, AF cannot help you guard against this except by reducing the failed auth count threshold required for a block rule.


