Here’s a method to find where any given NSUserDefault setting is persisted. This might help if you’re trying to write a script to get or set that setting. As a bonus, this post details a reusable strategy for withstanding the cacophonous onslaught of os_log long enough to find what you came for, or convince yourself it’s not there.
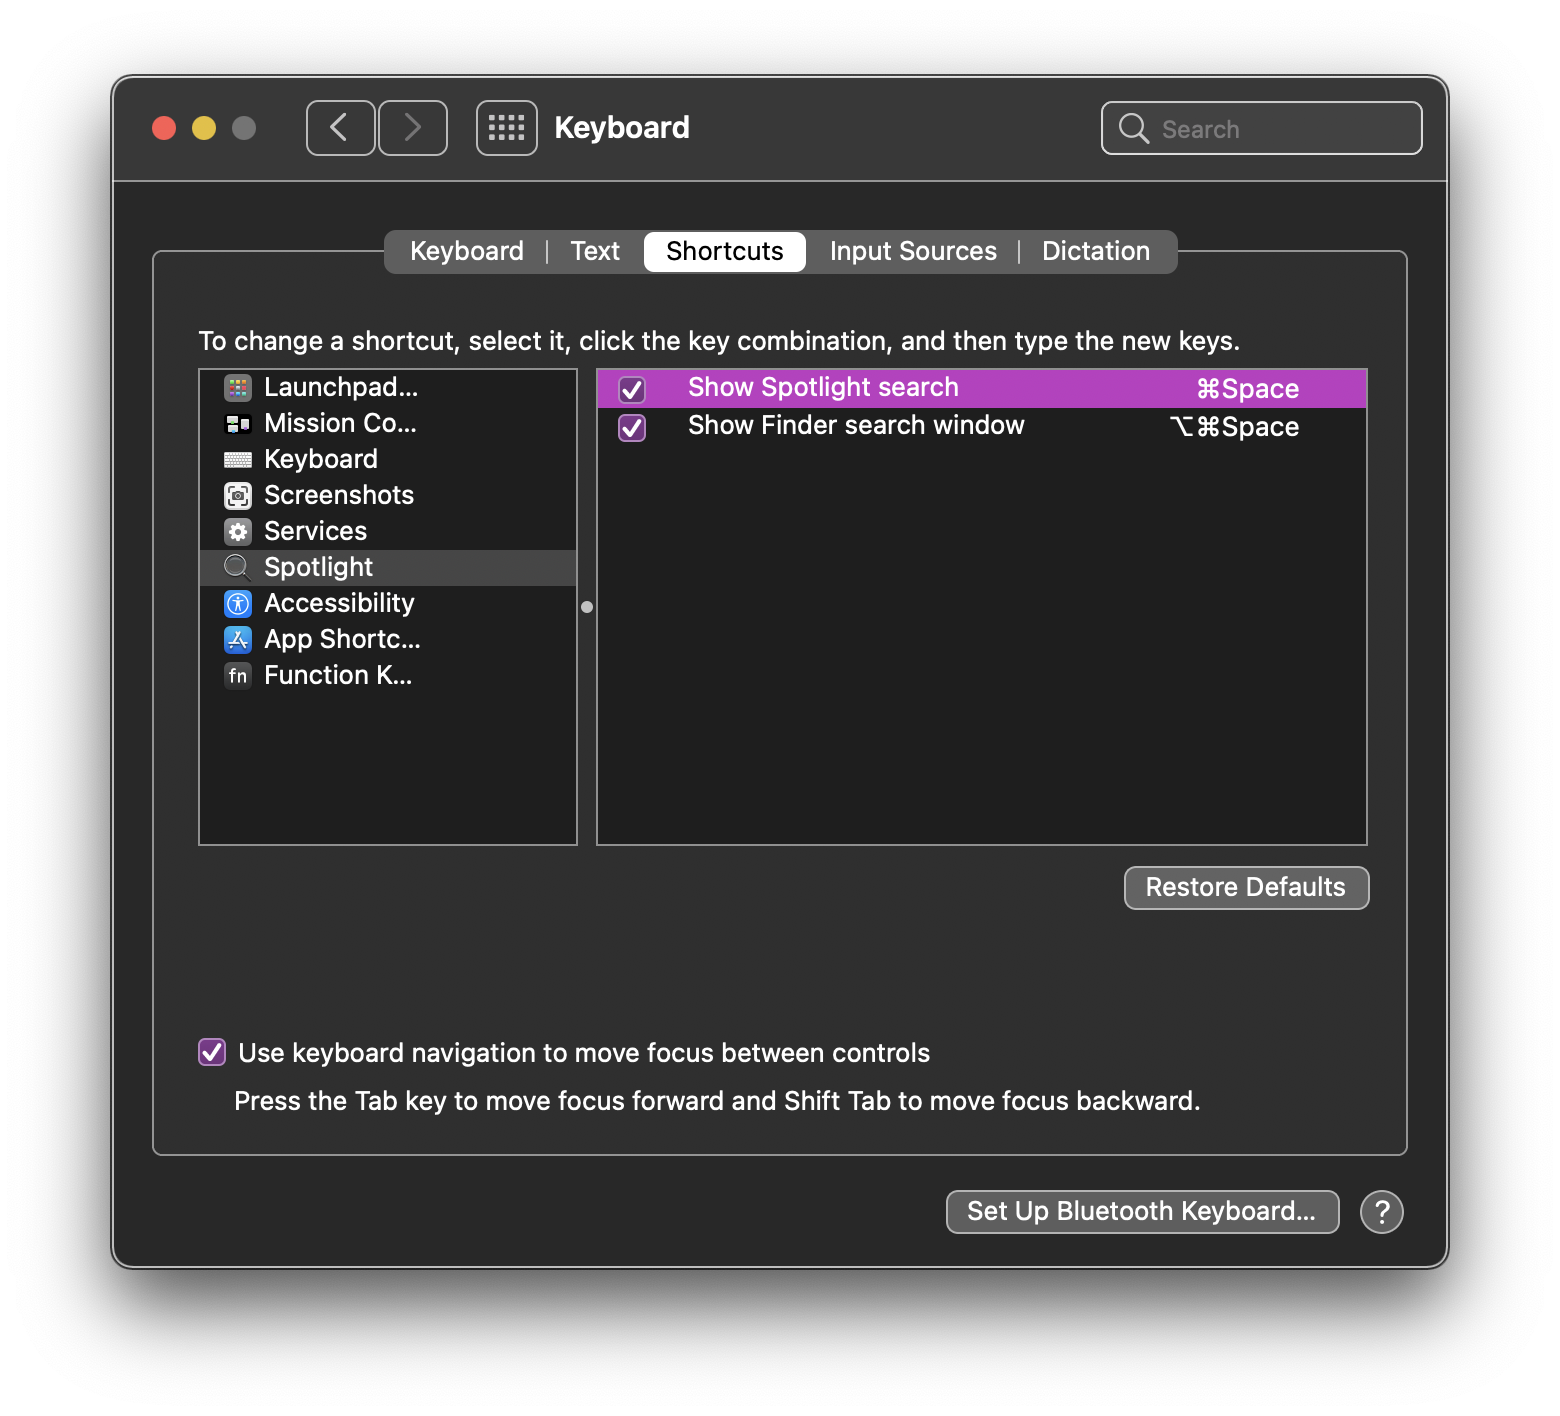
For this example, let’s say you’re trying to find where macOS stores the hotkey for invoking Spotlight. The UI for this is System Preferences –> Keyboard –> Shortcuts –> Spotlight, and the setting is called ‘Show Spotlight search’.
We know that macOS logs quite a bit – so much, in fact, that the hard part about using logs is achiving a favorable signal to noise ratio. It’s usually much easier to select signal than it is to filter noise – especially if you already know something about what you’re looking for. For this case study we can get an initial lead, but even if we couldn’t, our strategy will still work, maybe with an extra iteration or two.
The log man page tells us we can match log events in lots of ways, including by process – but which process should we look upon?
andre@boop ~ % apropos prefs
CPAN::Distroprefs(3)     - -- read and match distroprefs
cfprefsd(8)              - defaults server
If I didn’t already know that cfprefsd is our target, I would read the cfprefsd man page (because all apropos results are man pages). We could start by listening to all of cfprefsd by running:
log stream --debug --predicate 'process == "cfprefsd"'… but that output is not so easy to read. Let’s use log‘s ndjson output style so we can view it with jq, but first let’s make sure the json output is clean enough (foreshadowing!)
andre@boop ~ % log stream --predicate 'process == "cfprefsd"' --style ndjson --debug
Filtering the log data using "process == "cfprefsd""
{"traceID":36107480853643780,"eventMessage":"Process 68 (UserEventAgent)
...
Nope, jq won’t like that, so let’s filter the log output with egrep --line-buffered '^{' to only pass lines starting with { to jq. Don’t forget --line-buffered, otherwise grep ‘helps’ by saving a tiny fraction of computer by showing output less often, which grep believes is appropriate because it doesn’t think there’s a human watching (because its stdout isn’t connected to a terminal, it is connected to jq).
Before we continue, as our log command is becomming lengthy, let’s clean up a little by setting some common options in ~/.logrc (described in the log man page). Here’s a command to populate ~/.logrc with some settings useful for the task at hand:
cat > ~/.logrc <<EOF
stream:
   --debug
   --style ndjson

predicate:
   prefs 'process contains "cfprefsd"'
EOF
Now when we run log stream --predicate prefs, log behaves as though we typed:
log stream --debug --style ndjson --predicate 'process CONTAINS "cfprefsd"
Ok, putting it all together:
andre@boop ~ % log stream --predicate prefs | egrep --line-buffered '^{' | jq
{
  "traceID": 36107480853643780,
  "eventMessage": "Process 1347 (ContextStoreAgent) sent a request related to { ContextStoreAgent, user: andre, kCFPreferencesAnyHost, /Users/andre/Library/Preferences/ContextStoreAgent.plist, managed: 0 } (0x7fe2c19057d0)",
  "eventType": "logEvent",
  "source": null,
  "formatString": "Process %{public}d (%{public}s) sent a request related to { %{public}s, user: %{public}s, %{public}s, %{public}s, managed: %d } (%p)",
  "activityIdentifier": 7609380,
  "subsystem": "com.apple.defaults",
  "category": "cfprefsd",
  "threadID": 5781976,
  "senderImageUUID": "2A0E160E-9EE6-3B23-8832-6979A16EC250",
  "backtrace": {
    "frames": [
      {
        "imageOffset": 1698619,
        "imageUUID": "2A0E160E-9EE6-3B23-8832-6979A16EC250"
      }
    ]
  },
  "bootUUID": "",
  "processImagePath": "/usr/sbin/cfprefsd",
  "timestamp": "2021-03-20 18:30:44.017031-0700",
  "senderImagePath": "/System/Library/Frameworks/CoreFoundation.framework/Versions/A/CoreFoundation",
  "machTimestamp": 585248221966448,
  "messageType": "Debug",
  "processImageUUID": "5E5EBAAF-AA0E-38E1-B19A-07FB2FB8ECED",
  "processID": 406,
  "senderProgramCounter": 1698619,
  "parentActivityIdentifier": 0,
  "timezoneName": ""
}
...
Definitely more legible, but… the above represents a single log event. We can do better. eventMessage has the interesting info, so let’s look only at that by using a jq filter: '. | .eventMessage'
andre@boop ~ % log stream --predicate prefs \
| egrep --line-buffered '^{' | jq '. | .eventMessage'
"Process 1347 (ContextStoreAgent) sent a request related to { ContextStoreAgent, user: andre, kCFPreferencesAnyHost, /Users/andre/Library/Preferences/ContextStoreAgent.plist, managed: 0 } (0x7fe2c19057d0)"
"Process 1347 (ContextStoreAgent) sent a request related to { ContextStoreAgent, user: andre, kCFPreferencesAnyHost, /Users/andre/Library/Preferences/ContextStoreAgent.plist, managed: 0 } (0x7fe2c19057d0)"
"Process 97346 (PerfPowerServices) sent a request related to { com.apple.powerlogd, user: kCFPreferencesAnyUser, kCFPreferencesCurrentHost, /Library/Preferences/com.apple.powerlogd.plist, managed: 0 } (0x7fb3ee304a30)"
In this case that’s probably close enough, and you’ll probably see stuff about keys being written. Let’s pretend it’s still too noisy. What if we had a way to see only the different kinds of messages without the dynamic parts of each. We do! Just ask for formatString instead of eventMessage, then sort | uniq.
There is a complication, though. If you append sort | uniq to the previous pipeline and run it, you will see no output – this is because both sort and unique can’t run in stream mode; they have to receive all the input before they can do their job. If you simply control-c to terminate log, this seems to cause the in-flight log data to become malformed some time before it reaches jq. Instead of figuring that out, I opted to forgo log stream in favor of log show, because log show doesn’t run forever, so I won’t have to control-c it and have broken pipes.
There’s still one more problem (this is the last one, honest). Let’s have a look at the logd man page:
     All processes that use os_log(3) share pages of memory with logd and
     append entries to them.  logd reads pages and combines and compresses
     this data.  Depending on configured policies, it keeps them in a local
     ring buffer or writes them out to persistent storage.

           { logd }
              | `---> [ buffer ] ----.
              |                      ,`---> { log show }
              `---> [ data store ] -'
You may have noticed "messageType": "Debug", in the previous output, indicating that the messages of interest are logged at the debug level. When you pass the --debug option to log stream, log temporarily activates debug-level messages so you can see them as they happen, and then disables debug mode when you control-c. In other words, switching to log show won’t work until we enable debug-level messages some other way. There are at least two ways to do this according to the log man page:
# change the global log level to debug
sudo log config --mode "level: debug"

# ... or set a specific subsystem to debug
sudo log config --subsystem 'com.apple.defaults' --mode level:debug --mode persist:debug
I don’t like the first method because it doesn’t stick – the next time a log stream command exits, log helpfully disables debug-level messages, even if they were enabled before running log stream.
Note that when targeting a subsystem, we also need to enable persisting of the debug-level messages, otherwise those messages will briefly pass through the in-memory ring buffer before being forgotten.
We can now finally achieve a good summary of log activity by simply counting the unique instances of formatString values.
andre@boop % log show --last 10m --predicate prefs \
| egrep --line-buffered '^{' | jq '. | .formatString' > fstrings

andre@boop % cat fstrings | sort | uniq -c | sort -n
   1 null
  32 "Data for { %@, %@ } was purged due to memory pressure"
  32 "no cache for { %{public}s, %{public}s, %{public}s, %{public}s, managed: %d }, loading from %{public}s"
  38 "wrote file %{public}s"
  42 "Notifying observers of { %{public}s, %{public}s, %{public}s, %{public}s, managed: %d }"
  82 "Process %{public}d (%{public}s) wrote the key(s) %{public}s in { %{public}s, %{public}s, %{public}s, %{public}s, managed: %d }"
  90 "Process %{public}d (%{public}s) read data for { %{public}s, %{public}s, %{public}s, %{public}s, managed: %d }, backed by %{public}s"
 416 "Process %{public}d (%{public}s) sent a request related to { %{public}s, user: %{public}s, %{public}s, %{public}s, managed: %d } (%p)"
 482 "Couldn't %{public}s %{private}s due to %{public}s"
Ok, wrote file ... and process ... wrote the key(s) ... look promising for this sample case. Let’s update our .logrc file to add a stanza for show. Also change the prefs predicate macro to specify category = "cfprefsd" instead of process (not strictly required, but good to use categories when possible). Lastly, add another predicate macro called keys to conjure a refined version of the prefs search that will only return events that represent writes to NSUserDefaults.
show:
   --style compact
   --color always
   --last 1h
   --debug
   --style ndjson

stream:
   --debug
   --style ndjson

predicate:
   prefs 'category = "cfprefsd"'
   keys 'category = "cfprefsd" and eventMessage contains "wrote"'
Now we just use the keys predicate macro and clean the output with egrep and jq like before:
andre@boop ~ % log show --last 10m --predicate keys \
  | egrep --line-buffered '^{' | jq '. | .eventMessage'
...
"wrote file /Users/andre/Library/Preferences/com.apple.symbolichotkeys.plist"
...
If you came to learn how to claw law blogs from os_log’s sprawling maw, get on outta here Bob Loblaw – the rest is about hotkeys.
There are at least two different representations of hotkeys you might encounter in NSUserDefaults. NSUserKeyEquivalents (as in defaults find NSUserKeyEquivalents) is pretty self-explanatory, but there’s also AppleSymbolicHotKeys which is somewhat more opaque.
As an example of AppleSymbolicHotKeys, run
defaults find AppleSymbolicHotKeys > hotkey1.plist… then change the spotlight hotkey in system preferences, then run
defaults find AppleSymbolicHotKeys > hotkey2.plist… then diff these plists:
***************
*** 460,474 ****
              };
          };
          64 =         {
              enabled = 1;
              value =             {
                  parameters =                 (
!                     32,
!                     49,
!                     1048576
                  );
                  type = standard;
              };
          };
          65 =         {
              enabled = 1;
--- 460,474 ----
              };
          };
          64 =         {
              enabled = 1;
              value =             {
                  parameters =                 (
!                     107,
!                     40,
!                     786432
                  );
                  type = standard;
              };
          };
          65 =         {
              enabled = 1;
Looking at the whole file, it seems like maybe the different functions that can be assigned hotkeys are represented here by a numeric ID, and 64 is the one for “show spotlight search”. The parameter values are key codes.
I found a neat app called Key Codes that can be used to understand how the key code values work. For example, if I:
- disable the spotlight command-space hotkey so that Key Codes can capture that hotkey
- click the little ‘i’ button adjacent to ‘Modifiers’
- compare that to the data we found from NSUserDefaults
… we see that the codes for command-space are 32, 49, 1048576 – note especially that the stored value does not include the device-specific aspect of the modifier (0x8). This matches what is shown in the diff output above from hotkey1.plist
