Measuring system-wide activity on a computer usually begins by measuring the aggregate utilization of key hardware components like CPU, storage, and network. These kinds of metrics generally come in two different forms: counters and snapshots. Understanding the difference is important, because they are not always equally useful.
A counter keeps track of the total number of ‘units’ processed by the resource, like octets across a network device or blocks read or written on a storage device. (I am specifically avoiding the word ‘work’, because that’s a whole can of worms.) Counters usually start at zero (boot time) and increment forever until they roll over. Assuming a counter’s value is maintained by the sole arbiter of the hardware resource (i.e. the kernel), you can be confident that all the activity of that resource is represented in the counter’s value.
A snapshot, on the other hand, is basically a way to answer a question like “how much is happening right now” – the important part being “right now”. Computers are very fast, so any kind of instantaneous measurement often describes a very small time quantum – which is a very different scope compared to a counter’s reference point (“since boot”). Any sort of rate is a snapshot.
Let’s proceed to the thrust of this post with an automobile analogy: using CPU utilization to measure overall CPU activity is like trying to infer how far a car has traveled by looking at the speedometer instead of the odometer. To demonstrate, open Activity Monitor (or top, htop, etc), wait a few seconds to get a ‘baseline’, then run the following small shell script:
while true ; do /bin/echo zoop > /dev/null ; done
While that script is running, you should see an uptick in activity, but you may never see echo in the process list. That’s because the amount of time required by echo to zoop to /dev/null is small compared to the amount of time it takes to start any new process (on Darwin-based systems like macOS, iOS, etc). For that reason, any instantaneous snapshot of active processes is statistically unlikely to include very short-lived processes – even if there are thousands of such processes being spawned every second. You can see where some of that ‘startup time’ is going in the form of work done by long-lived processes like kernel_task or dznd.
As it happens, macOS does provide a way to poll usage counters for (recently) deceased processes. The CLI tool powermetrics can fetch it for you. Let’s ask for the tasks category of data and pull just the cputime_ms_per_s value from the all_tasks dictionary. Something in this data isn’t json-compatible so no svelte jq one-liners – let’s use Python.
#!python -u

import subprocess
import plistlib
import sys

"""
Print selected power metrics from /usr/bin/powermetrics at intervals, suitable for graphing.
"""

interval = sys.argv[1] if len(sys.argv) > 1 else 1000
cmd = f"sudo powermetrics -i {interval} -s tasks --format plist"

# Execute the long-running command, which produces one plist to stdout every
# interval, spread across multiple lines.
# For each line of output from `powermetrics`:
#   - accumulate lines into a bytearray
#   When "</plist>" is seen:
#    - parse the accumulated bytearray into a plist
#    - print the metric of interest
#    - clear the bytearray
pl = bytearray()
# using shell mode here because we need sudo for powermetrics
for line in subprocess.Popen(cmd, shell=True, stdout=subprocess.PIPE).stdout:
    pl.extend(line)
    # look for the plist close tag
    if "</plist>" in str(line):
        # powermetrics adds a null byte at the start of each plist after the
        # first, which breaks the plist parser.  Remove it.
        if pl[0] == 0:
            pl = pl[1:]
        d = plistlib.loads(pl[0:])
        print(d.get('all_tasks').get('cputime_ms_per_s'))
        pl = bytearray()
Make sure you have sudo rigged up to work without a password, or if you don’t, just run sudo whoami no more than 5 minutes before running the above in the same terminal. Instead of just reading lines of numbers, let’s pipe to ttyplot. Here’s a picture of a ttyplot showing what happens when I run the echo loop from earlier:
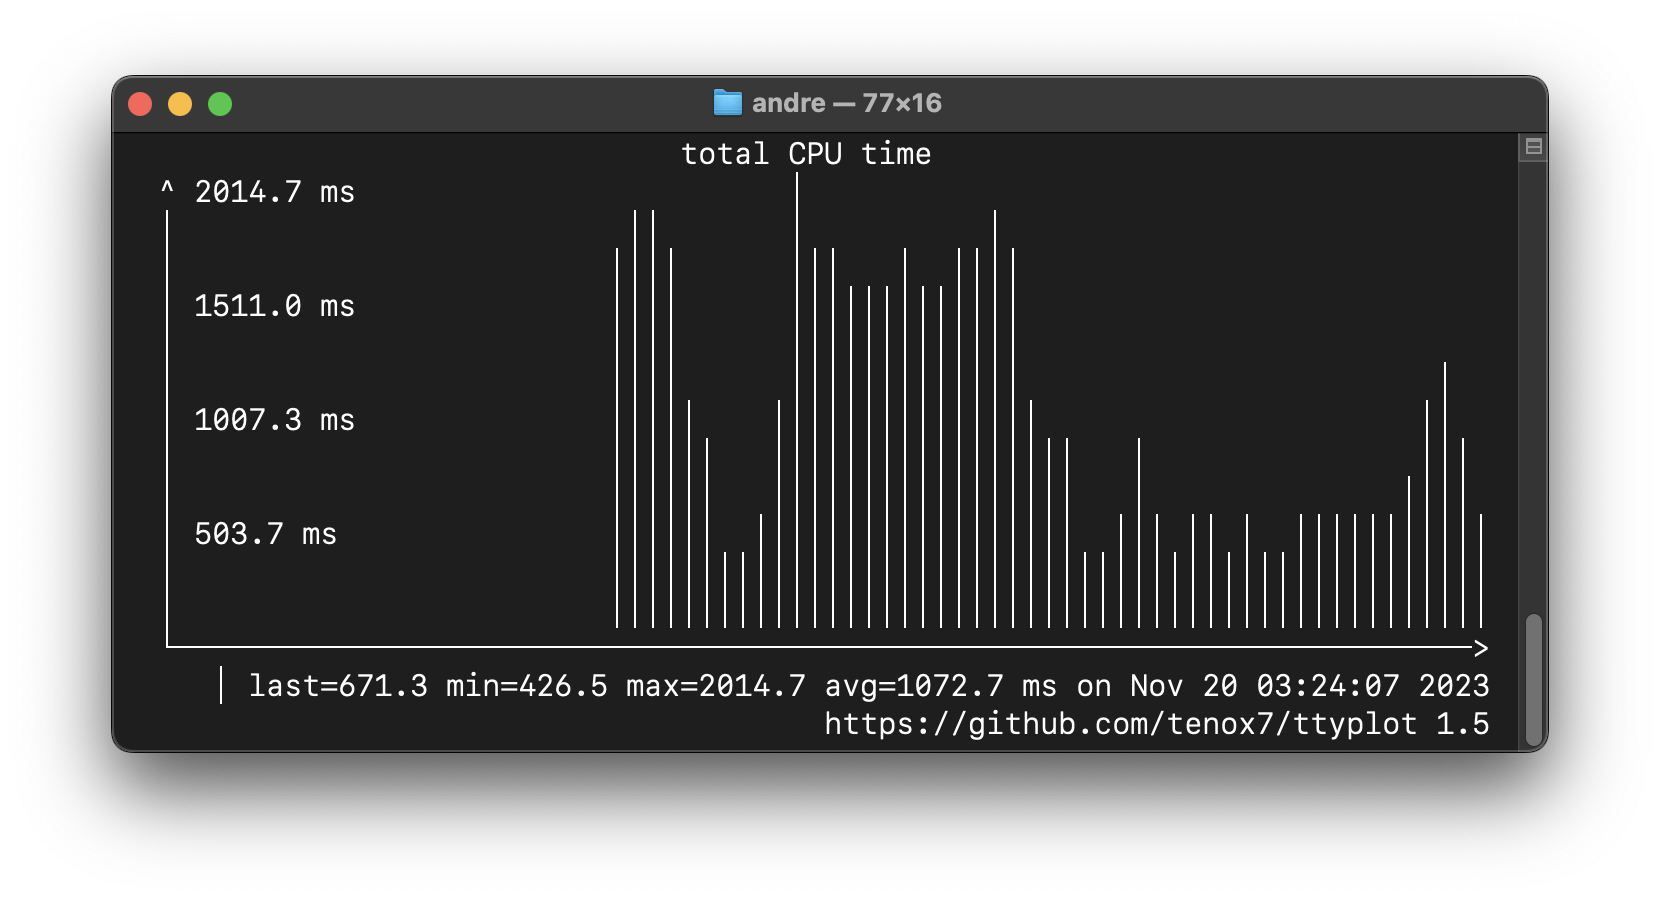
The big chunk there is when I was running the loop, but the first little chunk was ‘something else’. If this feels unsatisfying, you’re thinking correctly :) The difference between the low point and the high point in this graph feels around the same as the difference you can see in Activity Monitor or htop when running the echo loop. If your intuition suggests there’s more going on that we’re not yet seeing, that’s also correct!
Let’s stop beating around the bush: by far the best metric for measuring overall system activity level is power consumed. As the name suggests, powermetrics has that for us also. This time let’s ask for the cpu_power category, and fetch the value at processor.combined_power.

In the above graph, I ran the shell loop for two bursts that are clearly visible and substantially above the noise floor.
Here’s a gist of the python script.
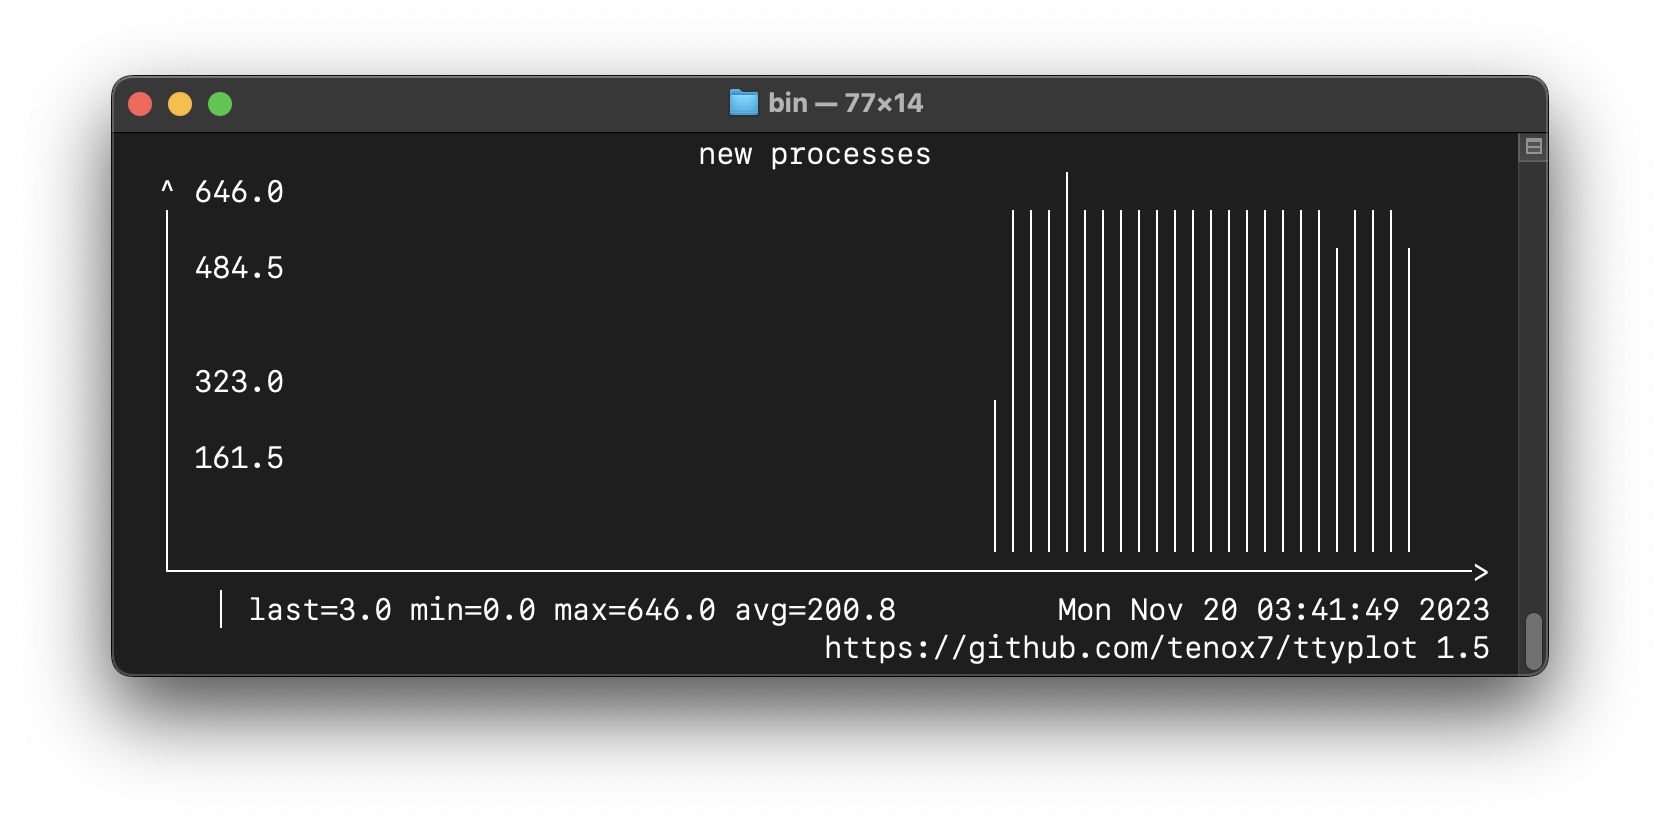
As a bonus, here’s a little program that prints out the number of new processes created every interval (without burning a PID in the process… heyo), which I will call pidpersec.c, as a nod to the script it’s replacing: pidpersec.d. Running the shell loop with that program’s output piped to ttyplot looks like this: